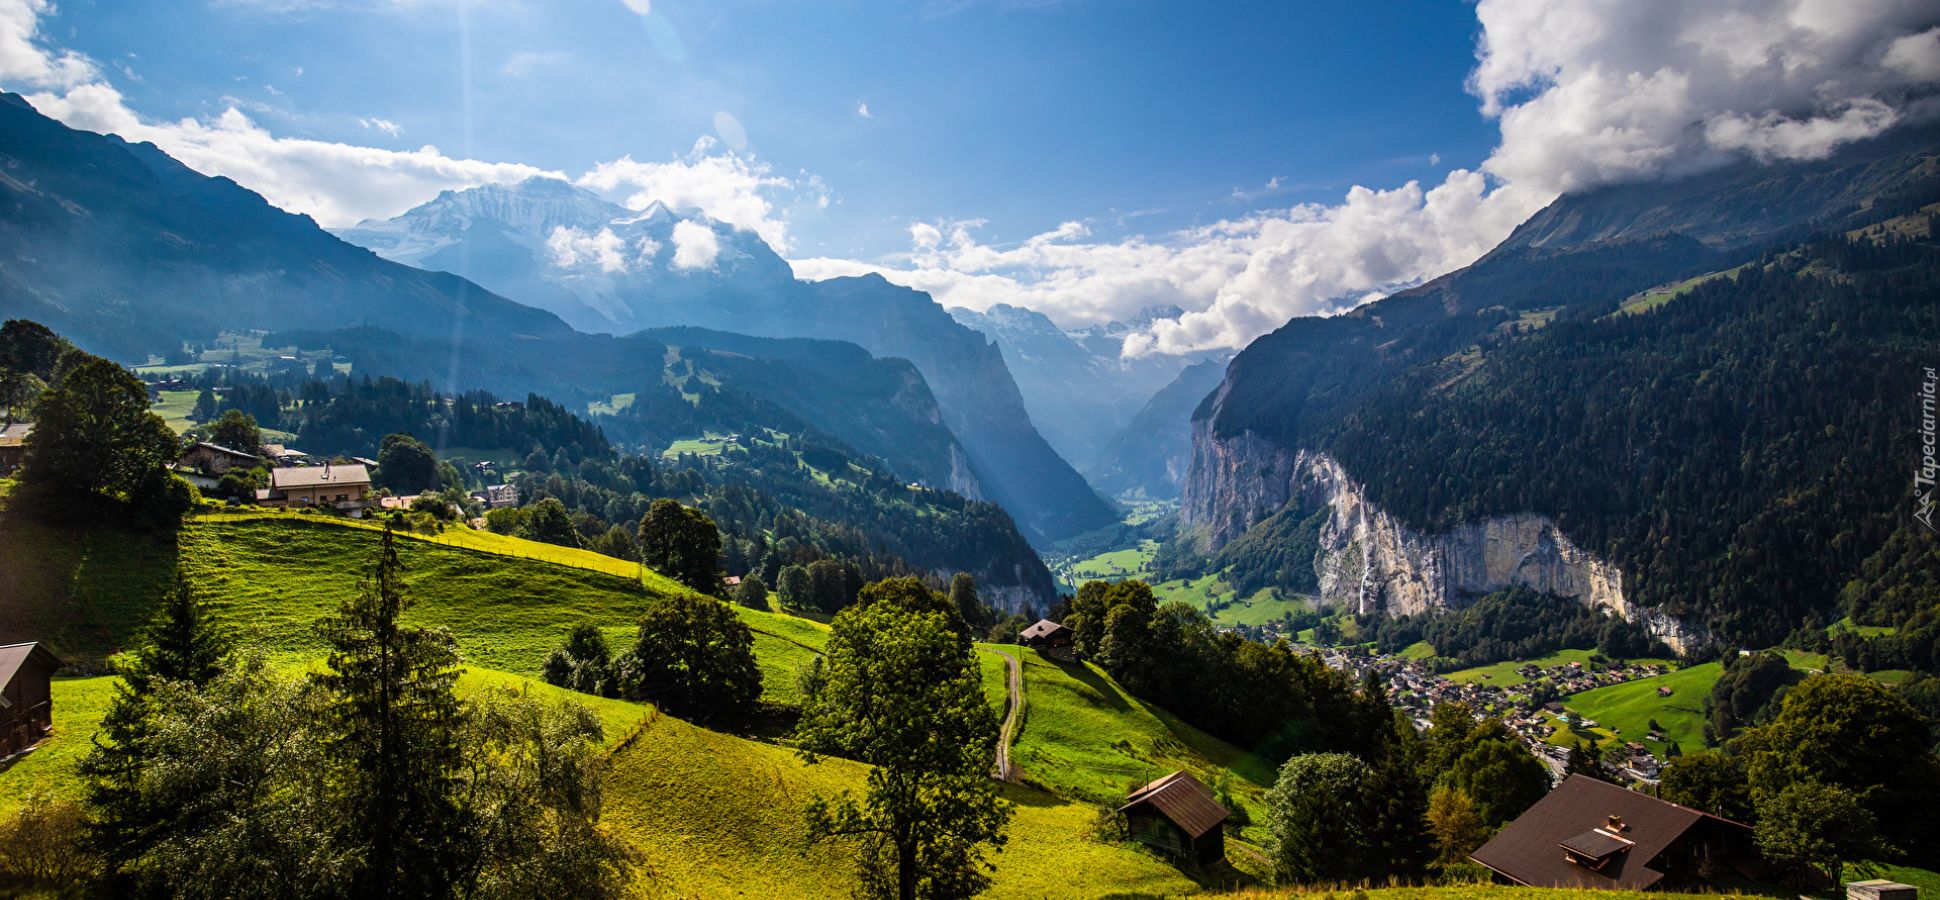
Switzerland ranks as the richest country by GDP per capita at market exchange rates, Singapore leads in purchasing power parity, and Norway tops the list when adjusting for hours worked, according to The Economist’s Rich List, which evaluates 178 nations across these three metrics.
GDP Metrics Explained: Measuring National Wealth
Countries can appear richer or poorer depending on the wealth metric applied. Here’s how The Economist breaks it down:
GDP per Capita at Market Exchange Rates
This simple calculation divides a nation’s total GDP by its population and converts it to U.S. dollars. It’s widely cited and intuitive, but it ignores differences in local prices and living costs.
Purchasing Power Parity (PPP)
PPP adjusts GDP per person based on local price levels. This measure accounts for what a dollar actually buys in each country, offering a more realistic comparison of living standards.
Adjusted for Work Hours
The third measure factors in both PPP and average hours worked per person. By combining income, cost of living, and labor input, it paints a holistic picture of how much free time and disposable income citizens enjoy.
Top 10 Richest Countries: Comparative Overview
Below is a snapshot of the top 10 countries under each measure in 2024. The table highlights how rankings shift based on methodology.
| Rank | Market Exchange Rate GDP per Capita | PPP-Adjusted GDP per Capita | Hours-Worked Adjusted GDP per Capita |
| 1 | Switzerland ($104,200) | Singapore ($151,000) | Norway ($115,000) |
| 2 | Singapore ($90,700) | Macau ($128,000) | Qatar ($111,000) |
| 3 | Norway ($86,800) | Qatar ($126,000) | Denmark ($92,300) |
| 4 | Ireland* ($85,400) | Norway ($112,000) | United States ($87,600) |
| 5 | United States ($85,800) | Switzerland ($93,800) | Switzerland ($90,200) |
| 6 | Qatar ($82,500) | United States ($86,600) | Ireland* ($88,500) |
| 7 | Denmark ($80,200) | United Arab Emirates ($84,900) | Singapore ($88,000) |
| 8 | United Arab Emirates ($78,900) | Ireland* ($83,600) | United Arab Emirates ($83,500) |
| 9 | Israel ($76,400) | Kuwait ($82,300) | Ireland* ($82,200) |
| 10 | Australia ($75,800) | Brunei ($81,000) | Kuwait ($80,100) |
Deep Dive: Top Spot in Each Measure
Switzerland Leads by Market Exchange Rates
Switzerland’s combination of a high-value currency and advanced financial services sector pushes its GDP per capita above $104,000. Strong banking, pharmaceuticals, and machinery exports reinforce its dollar-weighted lead.
Singapore Tops on PPP
With an adjusted GDP per person of $151,000, Singapore’s tight workforce, strategic location, and low tax regime generate immense purchasing power. Although living costs are high, wealth per resident still outpaces all other nations.
Norway Excels with Work-Life Balance
Norway’s hours-worked-adjusted figure of $115,000 reflects its high incomes, moderated work hours, and robust social welfare. Leveraging oil revenues and equitable labor laws, Norwegians enjoy both high earnings and more leisure time.
Why These Countries Rank Highest?
Strong Economic Structures
- Advanced Service and Finance Sectors: Switzerland and Singapore boast world-class banks and financial markets.
- Resource Wealth: Norway and Qatar harness natural resources oil and gas to generate outsized government revenues.
Population and Workforce Dynamics
Smaller populations with high participation rates amplify per-person metrics. Many European microstates and Gulf nations benefit from compact workforces supporting high GDP outputs.
Cost of Living and Income Distribution
PPP adjustments highlight how much citizens can purchase locally. Nations with subsidized essentials or price controls often rise in PPP rankings, reflecting higher real-world incomes.
For a deeper look at global billionaires, check out our analysis of the top richest people in the world.
Regional Patterns: Europe vs Middle East vs Asia
Across the top 20 averaged rankings:
- Europe Claims 12 Spots: High-value currencies, diversified economies, and transparent data contribute to European dominance.
- Middle Eastern Petro-States Shine: Qatar, United Arab Emirates, and Kuwait leverage hydrocarbons to boost national income metrics.
- Asian Tigers Emerge: Singapore and Macau prove that trade-oriented city-states can outperform much larger economies.
How the U.S Fares Among Wealthiest Countries?
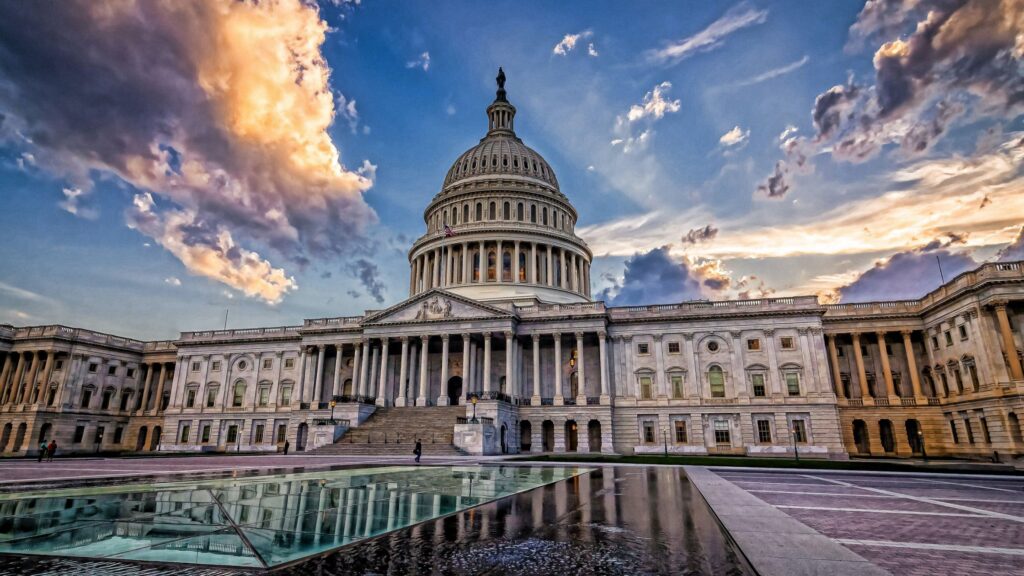
The United States sits comfortably in the global top ten:
- Market Exchange Rate GDP per Capita: 5th at $85,800
- PPP-Adjusted GDP per Capita: 6th at $86,600
- Hours-Worked Adjusted GDP per Capita: 4th at $87,600
Despite its massive economy, high inequality and longer average work hours slightly temper American standings across adjusted measures.
For insights into how individual fortunes stack up, explore our analysis of the richest actor in the world.
Emerging Economies: Who Might Break Into the Top Ten?
Several dynamic economies could crack the top rankings in the coming decade:
| Country | Latest GDP per Capita (USD) | Key Growth Drivers |
| Ireland | $83,600 (PPP) | Tech sector, low corporate tax |
| Brunei | $81,000 (PPP) | Oil, gas |
| Luxembourg* | $112,000 (exchange rate) | Banking, EU institutions |
| Qatar | $126,000 (PPP) | Natural gas |
Methodological Considerations and Limitations
Data Reliability and Exclusions
- Small Jurisdictions: Bermuda and Monaco are often omitted due to data gaps.
- Tax Arbitrage Effects: Ireland’s GDP is skewed by multinational profit shifting.
Demographic and Social Factors
Youthful populations (e.g., Burundi) or high retiree ratios (e.g., Italy) distort per-person figures. The share of working-age citizens directly impacts average income metrics.
What Does It Mean to Be the Richest Country?
Ranking rich countries reveals more than raw dollars. It exposes social models that balance earnings, leisure, and cost of living. Nations atop these lists often combine:
- High-value industries
- Favorable tax or subsidy regimes
- Transparent data collection
Their citizens tend to enjoy not just wealth but sometimes more free time and better public services.
Conclusion:
Determining the richest country in the world depends entirely on the lens you choose, whether it’s raw GDP per capita at market exchange rates, purchasing power parity, or an hours-worked adjustment. Switzerland, Singapore, and Norway each lead under one of these measures, illustrating that high income, real purchasing power, and a balanced work‐life dynamic reveal different facets of national prosperity.
These rankings highlight how economic structures, population size, and social policies shape wealth. Advanced service sectors, natural‐resource management, and strategic tax regimes all play pivotal roles in elevating countries to the top of the list. As global dynamics shift, keep an eye on emerging contenders like Ireland and Brunei, which leverage technology and resources to climb the wealth ladder.
For more in‐depth analyses of global economic trends and to stay updated on which nation will next claim the top spot, visit Grey Journal.
Frequently Asked Questions (FAQs)
1. What is the richest country in the world by GDP per capita?
Switzerland ranks first by GDP per capita at market exchange rates, averaging over $104,000 in 2024.
2. Which country has the highest purchasing power per person?
Singapore leads in PPP-adjusted GDP per person at $151,000, reflecting local cost advantages.
3. How does the hours-worked adjustment change rankings?
Factoring in work hours elevates Norway to the top, as its citizens earn high wages while working fewer hours.
4. Why isn’t Luxembourg always included in these rankings?
Luxembourg’s figures are inflated by cross-border commuters, which distorts true resident incomes.
5. Can emerging economies break into the top ten soon?
Countries like Ireland (tech sector growth) and Brunei (resource wealth) are strong contenders for future top rankings.